Excel Advanced 1
INTERMEDIATE Excel 2013
Managing Workbooks
Excel uses the term workbook for a file. The term worksheet refers to an individual spreadsheet within a workbook. A workbook can contain multiple worksheets, each have their own tab. It is possible to have multiple workbooks (xlsx files) open concurrently.
Switch among Open Workbooks
1. Open Excel and create two additional new workbooks (i.e: File> New> Blank Workbook)
2. Select the View tab> Window group> Switch Windows
3. In the menu that appears, you will see a listing of the workbooks that are open
4. Click the file that you want to bring to the foreground. The file that was in the foreground remains open, but is now in the background
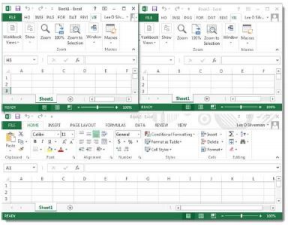
View Multiple Open Workbooks
1. Select View tab. Window group. Arrange All
2. Select Tiled and click OK
Managing Multiple Worksheets
An Excel workbook can contain many worksheets. This allows you to organize related worksheets into one file.
Move or Copy Worksheets between Workbooks
- Open the workbook you want to add a worksheet to
- Open the workbook containing the worksheet you want to insert into the other workbook
- Right-click on the tab of the worksheet you wish to copy
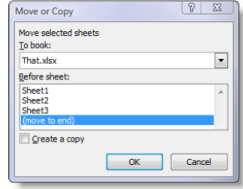
- Choose Move or Copy from the menu
- The “Move or Copy” window appears
- In the “To book:” Drop down list, select the workbook into which you want to insert the worksheet
- Select a location the “Before sheet.” box
- Click OK
You can also use this to copy sheets within a single workbook (be sure to check “Create a copy” or the sheet will move to the new location, deleting the original.)
Deleting a Worksheet
- Right click on the worksheets(s) that you want to delete
- Choose Delete
If the selected sheet has data on it, you will be asked to confirm to avoid accidentally deleting data.
Changing Worksheet Names
By default, worksheets are named Sheet 1, Sheet 2, etc. Worksheet names can be changed to accurately reflect their content.
- Double Click on the worksheet tab for which you want to change the name and it will highlight
- Type in a new name for the worksheet.
- Press the Enter key
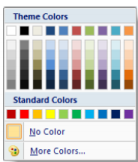
Changing Tab Color
By default, all worksheet tabs are white. You can change the tab color – the active worksheet’s tab will still appear white with a thin colored underline, the inactive worksheets will display the selected tab colors.
- Right click on the worksheet you want to change the color of
- Choose Tab Color from the shortcut menu
- Select the desired color and click OK
Changing Worksheet Order
- Click and hold down on the tab of the worksheet you want to move
- Drag this worksheet tab to the right or left, you will notice a down arrow indicating the position of the worksheet
- When the down arrow reaches the place where you want the worksheet to be located, release the mouse button
Freezing Worksheets
When working with large or complex worksheets, scrolling can sometimes become a problem. Freezing panes allows you to keep row and column labels visible as you scroll.
To enable this option:
∙ Select the View tab> Windows group> Freeze Panes
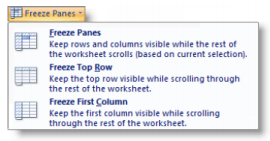
You can freeze the top row or first column to hold labels in place, or both columns and rows.
To turn off this option:
∙ Select the View tab > Windows group > Freeze Panes > Unfreeze Panes
Filtering
You can filter to select records that match specific criteria. This gives a temporary view of data without physically removing anything. To isolate individuals from Florida, we do the following:
1. Click in a cell where headings are in row 1
2. Choose the Data tab> Sort & Filter group > Filter
3. Select Fla. In the Sate drop-down
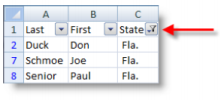
4. To remove the filter, click the Filter Button

PivotTables & PivotCharts
A PivotTable interactively allows for quickly summarizing large amounts of data. You can rotate its rows and columns to see different summaries of the source data, filter the data by displaying different pages, or display the details for areas of interest. Pivot Charts are associated with Pivot Tables and provide graphical representation of the same information.
Use a PivotTable when you want to compare related totals, especially when you have a long list of figures to summarize and you want to compare several facts about each figure. Because a Pivot Table is interactive, you can change the view of the data to see more details or calculate different summaries. This gives a customized perspective on the data without having to change anything in the range of cells it is based on.
Creating a PivotTable & PivotChart
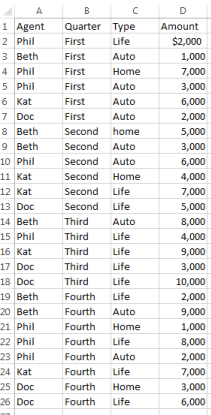
In this example, we will take raw data based on four agents at an insurance company and look at their sales over the course of a year for three different product types. The existing data was entered in such a way that it is somewhat redundant and hard to draw conclusions from readily. By placing it into a Pivot Table with an associated chart, we can easily streamline this into useful information and quickly manipulate it into multiple views to help us draw conclusions. We begin with the following sheet:
Activity
Follow these steps to create a PivotTable and Pivot Chart from the provided data.
1. Select the range that encompasses the hearings and data (A1:D26)
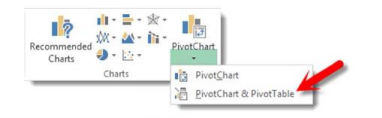
2. Select the Insert tab > Charts> PivotChart drop-down> PivotCharts PivotTable
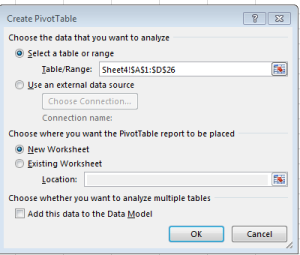
3. Click OK to confirm the selected range
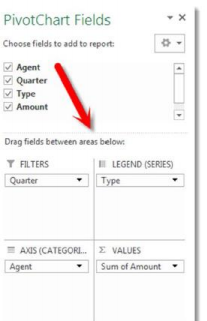
4. Drag the 4 fields in the top portion of the “PivotTable Field List” to the 4 locations in the “Drag fields between areas below” section as shows:
A PivotTable and corresponding Pivot Chart are shown:
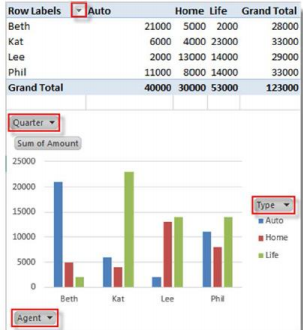
5. Manipulate the drop-down areas of the PivotTable to change what aspects are displayed for the table and the chart.
Sorting
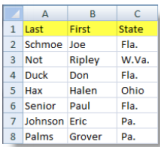
Information can be sorted into alphabetical or numerical order, ascending or descending. Excel can change the row numbers that related information appears in while still keeping items together. A common type of sort is alphabetically by last name, and secondarily by first name.
1. Select a cell within the range to be sorted (example: A1)

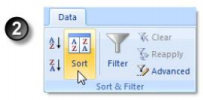
2. Select the Data Tab > Sort & Filter group > Sort
3. Check the My data has headers option
4. Select Last in the
5. Click Add Level
6. Select First in the “Then by” space
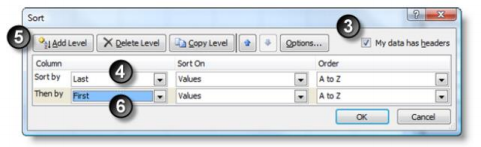
7. Click OK
The selected rows are no in ascending alphabetical order by last name, and then secondarily by first name.